|
Modelling the shelf circulation off eastern Tasmania (Oliver et al., Continental Shelf Research, 2016)
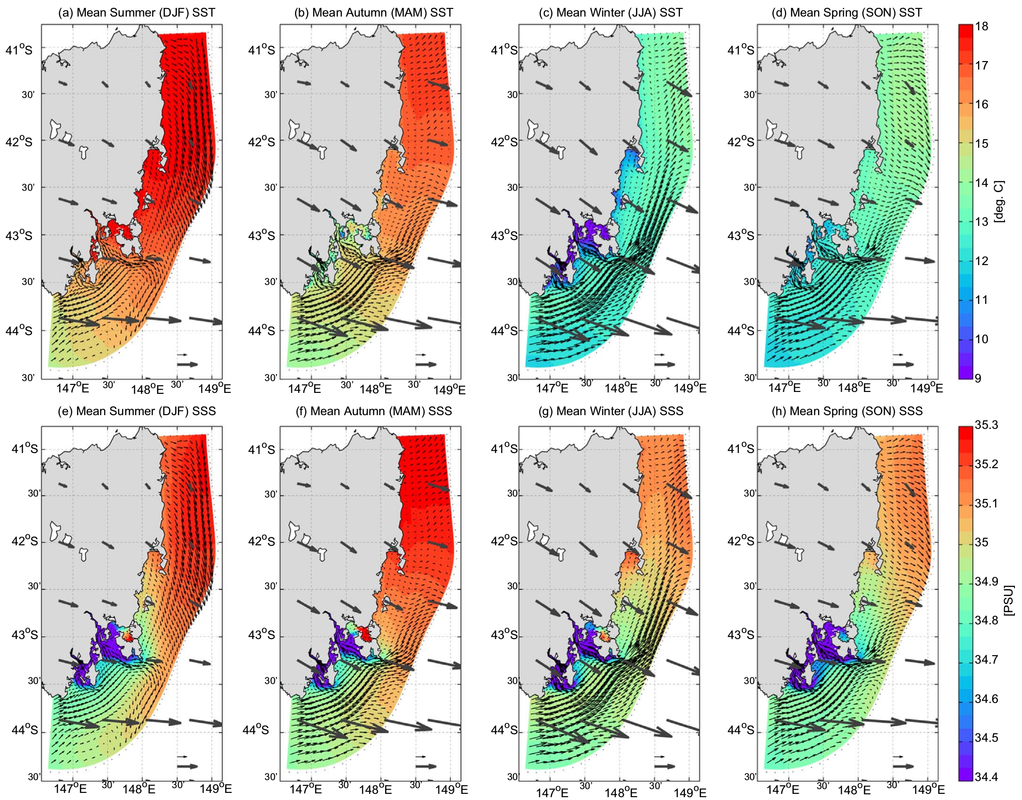
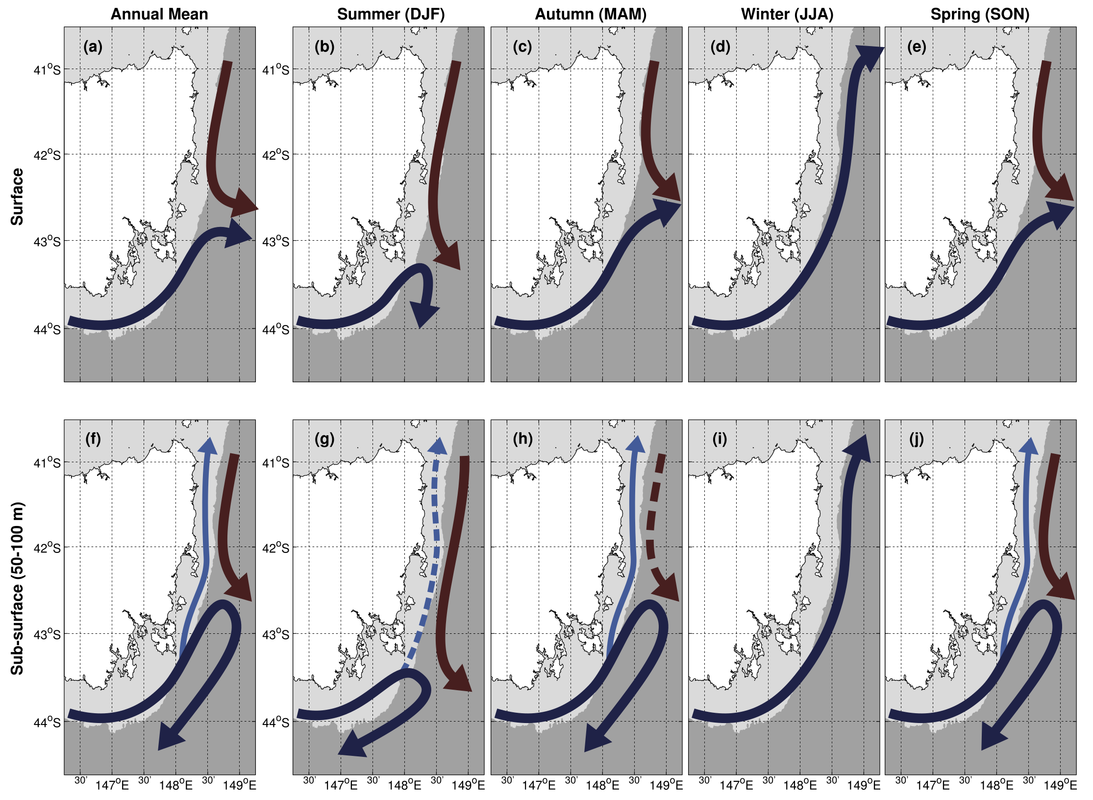
Abstract: The marine waters across Tasmanian's eastern continental shelf are biologically productive and home to economically important fisheries and aquaculture industries. However, the marine climate there is poorly understood. We use a high-resolution (∼2 km in the horizontal), three-dimensional ocean model for eastern Tasmania (ETAS) to examine the simulated mean state and seasonal cycle of temperature, salinity and three-dimensional flow field, and the evaluation of daily model outputs against in situ and remote observations for the 1993–2014 period. We also use the model to examine the roles of river input and tidal forcing. The model is evaluated against remotely-sensed sea surface temperature and in-situ observations of sea level and subsurface temperature, salinity, and currents. The mean state demonstrates the influence of two well-known boundary currents (the East Australian Current, EAC, and the Zeehan Current, ZC) as well as the effects of local freshwater input from river runoff. The EAC is dominant in summer and the ZC in winter; the influence of the EAC also increases northwards and in the offshore direction. In addition, the model indicates the presence of a semi-permanent subsurface (50–100 m depth) northward flow trapped near the coast. Cool freshwater runoff from the Derwent and Huon Rivers directly impacts the temperature and salinity in their estuaries but has little influence further across the shelf. Tidal forcing impacts the mean state through tide-river interactions which flush Frederick Henry Bay and Norfolk Bay with freshwater. Tidal forcing also impacts the variability of temperature all along the coastline, most likely due to changes in the turbulent mixing near to the coast. The ETAS model output data are available as a high-resolution representation of the mean state, seasonal variations, and interannual variability of Tasmania's eastern continental shelf marine climate. This model allowed us to generate our best estimate of daily, three-dimensional ocean variability over the shelf off eastern Tasmania (dataset available here), including seasonal climatologies: 
Figure 1: Seasonal cycle of surface temperature, salinity and circulation over the eastern Tasmanian Continental Shelf. Shown is the annual mean (first row) surface temperature and currents and (second row) surface salinity and currents for (first column) summer, (second column) autumn, (third column) winter, and (fourth column) spring. Grey arrows indicate surface wind. The reference arrows in the bottom right of each panel represent 10 cm/s (2 m/s) for the ocean (atmosphere). Note that only every third (second) vector, in each direction, has been plotted for oceanic (atmospheric) velocities.
We then were able to generate a schematic view of the seasonal surface and subsurface circulation:

Figure 2: Schematic of surface and subsurface circulation on the eastern Tasmanian continental shelf. The red arrow indicates the EAC Extension, the dark blue arrow indicates the Zeehan Current, and the light blue arrow indicates the northward coastal current. Dashed arrows indicate currents that are not clearly represented as a continuous flow in the model simulations. The light grey area indicates water depths less than 200 m.
|
