ERIC OLIVER
  • Home
  • People
  • Research
    • Marine Heatwaves
    • MJO Reconstruction
    • East Australian Current
    • Dynamical Downscaling
    • Statistical Downscaling
    • MJO and Sea Level
    • Extreme Currents
    • Extreme SSTs
    • Predictability
  • Teaching
    • Sea Ice
  • Publications
    • CV
    • Articles
    • Presentations
  • Data & Code
    • Code
    • Published datasets
    • Rossby radius
Search

Historical Reconstruction of the Madden-Julian Oscillation Index

The MJO index of Wheeler and Hendon (2004) has been reconstructed back to the early 20th century. This reconstruction was generated by multiple linear regression of surface pressure time series, from the Twentieth Century Reanalysis (20CR), at 12 locations onto the Wheeler and Hendon (2004) index (Oliver and Thompson, Journal of Climate, 2012).

Daily values of the reconstructed index are available for download. The current version of the index is based on 20CR V3 and covers 1905-2015. Previous versions include one based on 20CRV2C (covering 1905-2014) as well as the original index presented in Oliver and Thompson (2012). For the version based on 20CRV2c, both a single index (defined based on the ensemble mean pressure) and an ensemble of 54 indices each based on the ensemble-members of 20CR V2c are available.
  • 20CRV3: Single index (ensemble mean): plain text, matlab
  • 20CRV2c: Single index (ensemble mean): plain text, matlab, netcdf 
  • 20CRV2C: Ensemble of 54 indices: plain text, matlab, netcdf 
  • The original index as presented in Oliver and Thompson (Journal of Climate, 2012) based on 20CR V2 and covering 1905-2008: plain text, matlab, netcdf 
​
​The locations from which Twentieth Century Reanalysis pressure series were taken are shown by white circles: 
Picture
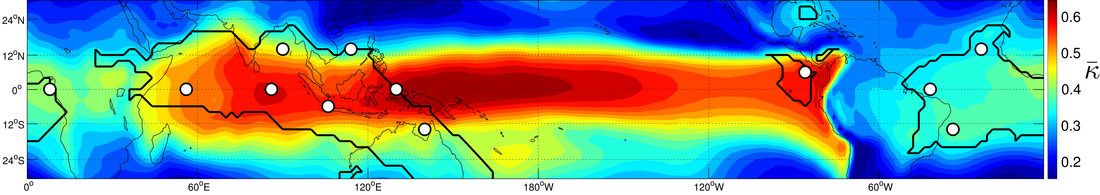
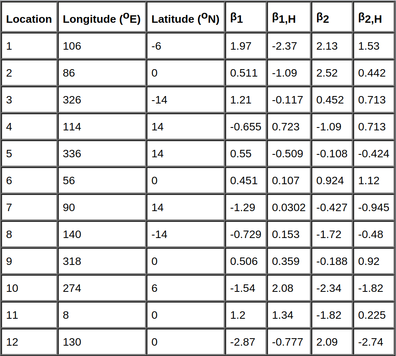
Exact locations, along with regression coefficients, are given in the table below. The regression coefficients were calculated by least-squares linear regression of the Wheeler and Hendon (2004) index onto the bandpassed pressure series over the 1979 to 2008 period. 
Picture
The reconstructed index, IHR, is generated by linear combination of bandpassed pressure series, p, and their Hilbert transforms, pH: 
Picture
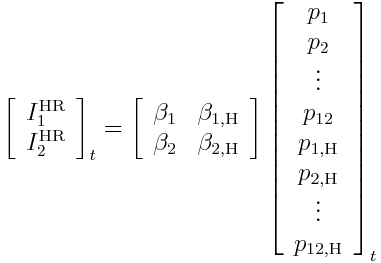
where t is a time index and the β are 1 x 12 row vectors with values given in the table above.

Extensive validation of the reconstructed index over the pre-1979 period was performed. For example, the connection between the MJO and various environmental variables has been calculated using the Wheeler and Hendon (2004) index and the reconstructed index over various time periods:
  • Tropical surface wind and cloud cover
  • Austral Summer extreme precipitation over Australia
  • Sea level variability in the Western Pacific, Gulf of Carpentaria, and along the West coast of the Americas

Furthermore, studies have begun using the reconstructed index to examine the stability or multidecadal variability of known MJO connections over the twentieth century:
  • Alaska wintertime surface air temperature
  • Tropical Cyclones globally and in the North Atlantic
  • New England snowfall
  • Joint modulation of Australian rainfall by the MJO and ENSO

​Through the development of this index it was found that great care must be taken when using reanalysed surfaced pressures from 20CR. By arbitrarily choosing predictor locations one can control the long-term trend in MJO amplitude between approximately zero and an increase of 30%.
Powered by Create your own unique website with customizable templates.
  • Home
  • People
  • Research
    • Marine Heatwaves
    • MJO Reconstruction
    • East Australian Current
    • Dynamical Downscaling
    • Statistical Downscaling
    • MJO and Sea Level
    • Extreme Currents
    • Extreme SSTs
    • Predictability
  • Teaching
    • Sea Ice
  • Publications
    • CV
    • Articles
    • Presentations
  • Data & Code
    • Code
    • Published datasets
    • Rossby radius